SPICE3-hacking primer

From Electriki
Revision as of 21:42, 7 April 2011 by Michai (talk | contribs) (Created page with "== Meh? == I heard a lot about SPICE, and never used it outside of one of its many fuzzy packages, e.g. PSpice. Googling by accident showed that SPICE-models representing simple...")
(diff) ← Older revision | Latest revision (diff) | Newer revision → (diff)
Jump to navigationJump to search

Meh?

I heard a lot about SPICE, and never used it outside of one of its many fuzzy packages, e.g. PSpice. Googling by accident showed that SPICE-models representing simple circuits can be extremely short, so let's try.

If you spot an obvious mistake, please tell or change this page.

My goal here was clearly to simulate small and isolated parts of circuits using mainly passive components; a simple setup can be hacked together and simulated, well, within tens of seconds, really.

A lot of funny plots are about to greet your eyes. SPICE can do a lot more than all this.

I use the ngspice incarnation on a NetBSD system, plotting directly to my monitor.

Real docs

I don't like the original SPICE3 docs; I guess everything is explained, but it feels incoherent and IMHO it could have been twice as long without being too long.

TBD - ori docs in var fgormats - wikipedia - spice models from downstairs pc - spice docs from mail TBD

Examples

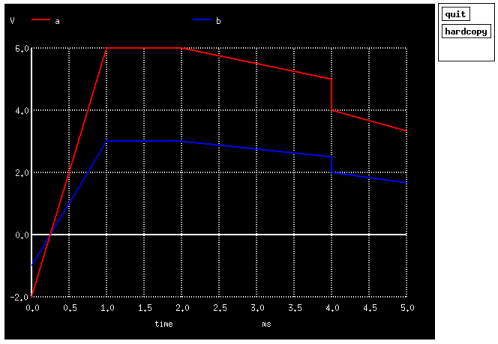
Piece-wise linear: voltage-source with V/t-curve consisting of line segments

1 pwl.png
transient analysis: (P)iece-(W)ise (L)inear voltage-source

*** Voltage source shows different ramps using 'pwl()'
*
*   Parms are duples ( t, V ); i.o.w. at time 't', voltage is 'V'.
*   Intermediate points are calculated using linear interpolation.

v a 0 pwl( 0 -2   1m 6   2m 6  4m 5   4.001m 4   10m 0 )
ra a b 1k
rb b 0 1k

*** Show only the first 5 ms in steps of 1 us

.control
tran 1u 5m
plot a b
.endc

.end

this text should be below table

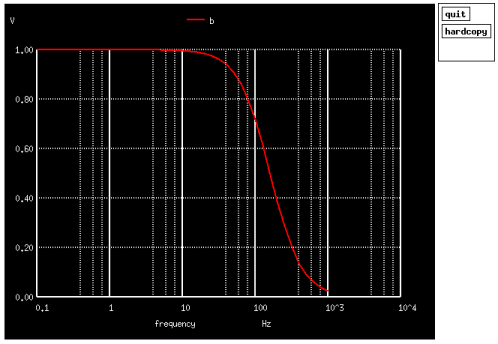
AC (frequency-) analysis of a simple low-pass filter

2 ac.png
AC-analysis: low-pass filter, 159 Hz cutoff freq

*** Voltage-source has AC-component of 1V amplitude

v a 0 dc 1 ac 1
r a b 1k
c b 0 1u

*** Simulate using decade variation, 10 points per decade, 
*   with frequency varying from 0.1 Hz to 1 kHz

.control
ac dec 10 .1 1k
plot b
.endc

.end

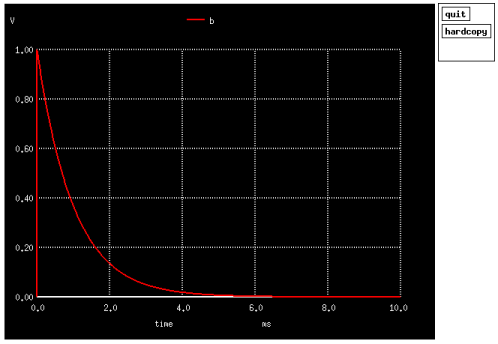
Initial conditions: giving a component an initial value

3 ic.png
transient analysis: discharging a cap with initial condition

*** The cap has an (I)nitial (C)ondition of 1V. Voltage-source is a dummy.

v a 0 dc 0
r a b 1k
c b 0 1u ic=1

*** Simulate first 10 ms in steps of 10 us, and (U)se initial conditions

.control
tran 10u 10m uic
plot b
.endc

.end

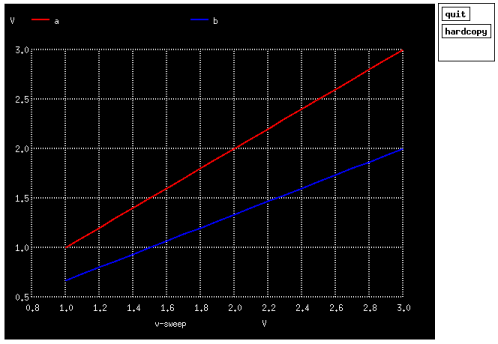
DC-sweep: ramp a (voltage-)source from start- to end-value

4 dcsweep.png
DC-analysis: sweep on voltage source

*** No need to specify voltage source properties since we'll do that in simulation

v a 0
r1 a b 1k
r2 b 0 2k

*** Sweep voltage source from 1 V to 3 V in steps of 0.1 V

.control
dc v 1 3 .1
plot a b
.endc

.end

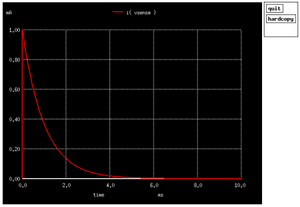
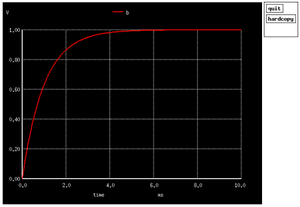
Current-measurement using a dummy voltage-source (0V)

5 imeas 1.png
5 imeas 2.png
transient analysis: current-measurement using 0V voltage source

*** Dummy (0 V) voltage-source 'vsense' between resistor and cap

v a 0 dc 1
r a b 1k
vsense b c dc 0
c c 0 1u

*** Show current through dummy voltage source, and (effectively) cap voltage
*
*   CAVEAT: 'uic' _must_ be added, else cap behaves as open circuit

.control
tran 10u 10m uic
plot i( vsense )
plot b
.endc

.end

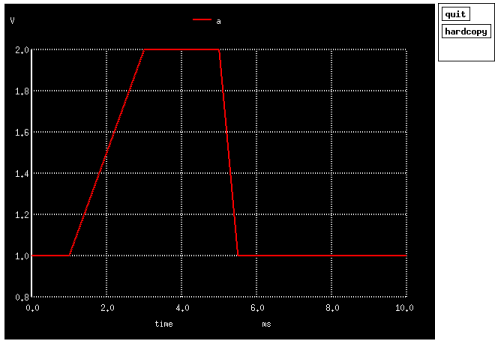
Pulsed source using nonzero rise- and fall-times

6 pulse.png
transient analysis: pulsed voltage-source

*** Very convenient way to specify pulse-shaped stimulus.
*
*   Parms are <V_initial> <V_pulsed> <T_delay> <T_rise> <T_fall> <T_width>
*   Intermediate points are calculated using linear interpolation.

v a 0 pulse( 1 2 1m 2m .5m 2m )

.control
tran 10u 10m
plot a
.endc

.end

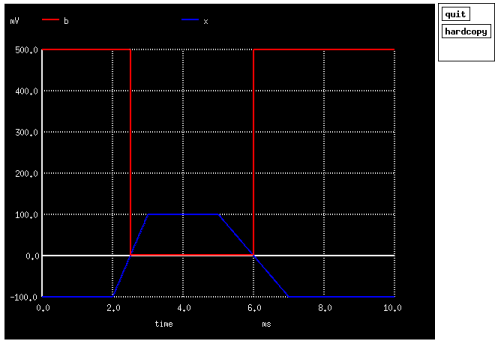
Physical pushbutton switch using helper voltage-source

7 switch.png
transient analysis: voltage-controlled switch over a resistor

*** Simple 1:1 voltage-divider with N.O. pushbutton over 2nd resistor

v a 0 1
r1 a b 1k
r2 b 0 1k

*** Switch 's' with normal properties (e.g. threshold at 0V).
*
*   Voltage source generates a 'sloped' pulse crossing the
*   0V-level, closing and opening the switch.

s b 0 x 0
vs x 0 dc 0 pulse( -.1 .1 2m 1m 2m 2m )

*** Plot voltage over 2nd resistor and switch-control voltage

.control
tran 10u 10m
plot b x
.endc

.end

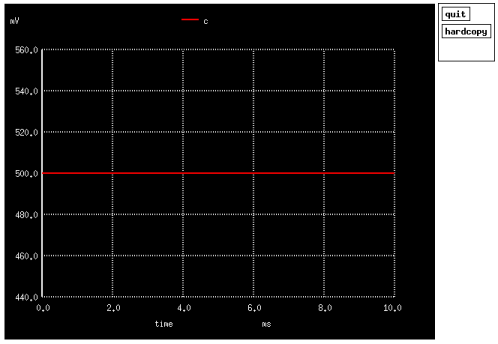
Voltage-controlled voltage-source as sad excuse for opamp-model

8 vcvs.png
transient analysis: VCVS with unity gain

*** Simple 1:1 voltage divider acts as voltage-source with 1k 
*   internal resistance and 1k load (Vb = Vv / 2 )

v a 0 1
r1 a b 1k
r2 b 0 1k

*** VCVS with control-voltage Vb feeds r3, but doesn't 
*   add load to above circuit. This is an extremely simple
*   (and wrong) way to model a voltage-follower or analog buffer.

e c 0 b 0 1
r3 c 0 1k

.control
tran 10u 10m
plot c
.endc

.end